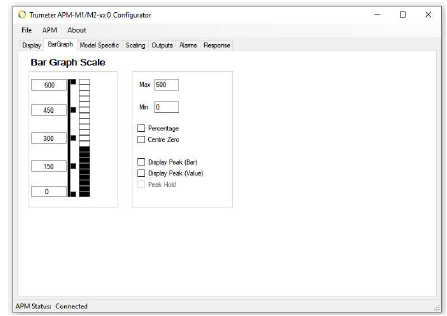
Bar Graph Scale This is where you configure the minimum and maximum values of your input. |
|
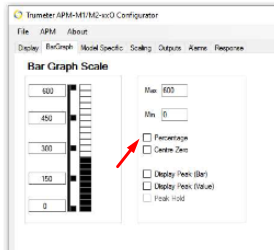
Step 1: Checking the Percentage box will give you a percentage of the input value that the APM is reading.
|
|
Step 2: Checking the Centre Zero box will allow the display to show positive and negative values. (Image A)
|
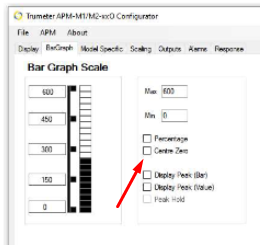 Image A Image A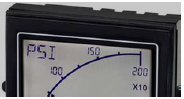 Image B Image B |
Step 3: Checking Display Peak provides a visual indication of the average peak value on the bar graph display. • The duration the peak bar is visible is configurable from a few seconds to a few minutes by adjusting the Peak Bar slider on the Response tab. (Image A) • Alternatively, if you want the Peak Bar to be latched on and show the maximum value since the unit was reset, click Peak Hold. |
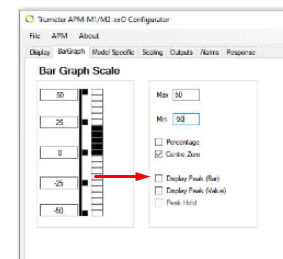 Image A Image A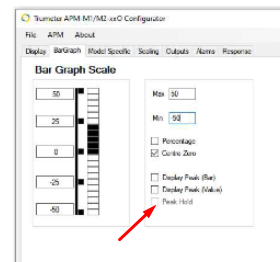 Image B Image B |
English